
Download Stock Chart APK – stock chart, stock analysis, technical analysis, US stock markets, free stock chart app, real-time stock quotes, buy sell signals, support resistance, Bollinger Bands, MACD, RSI, moving average
Overview
Stock Chart is a free Android application designed for users interested in technical analysis of US stock markets. Developed by Stoxline, the app provides access to real-time data and visualization tools for stocks listed on major exchanges, including the New York Stock Exchange (NYSE), NASDAQ, and the American Stock Exchange (AMEX). Its primary purpose is to deliver a streamlined, accessible platform for analyzing market trends through advanced charting features. The app is particularly suited for retail investors, day traders, and finance enthusiasts seeking a no-cost alternative to premium charting platforms.
By offering tools such as support and resistance levels, moving averages, and multiple technical indicators, Stock Chart enables users to identify potential entry and exit points in the market. The inclusion of real-time buy, sell, or neutral signals adds a layer of decision-making support. The application’s interface is designed for ease of navigation, allowing users to quickly switch between different stocks and timeframes. While the developer did not provide additional system requirements, the app is optimized for Android devices and available exclusively on Google Play. It serves as a practical tool for on-the-go market analysis, especially for those who prefer mobile access to financial data.
Key Features & Capabilities
- Real-time stock quotes – Users can monitor current prices for NYSE, NASDAQ, and AMEX-listed stocks, enabling timely trading decisions.
- Multi-time frame charting – The app supports viewing charts across various time intervals, allowing users to analyze both short-term and long-term trends.
- Technical analysis indicators – Built-in tools include MACD, RSI, Stochastic Oscillator, MFI, ROC, and Williams %R, which help assess momentum and overbought/oversold conditions.
- Moving averages – Users can visualize SMA, EMA, and WMA trends to identify directional bias and potential reversal points.
- Support and resistance charts – The app highlights key price levels where market sentiment may shift, aiding in strategic planning.
- Bollinger Bands – These volatility-based bands help detect potential breakout or reversal opportunities.
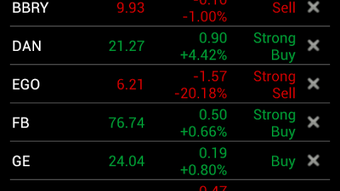
- Buy/Sell/Neutral signals – Real-time signals are generated based on indicator convergence, offering actionable insights without requiring advanced knowledge.
These features collectively support a comprehensive technical analysis workflow. For example, a user can combine RSI and MACD readings on a 15-minute chart to confirm a bullish signal before executing a trade. The app’s ability to display multiple indicators simultaneously enhances analytical depth. The developer did not specify additional functionality beyond these core tools, but the current set is sufficient for foundational technical analysis. This makes Stock Chart a practical choice for beginners and intermediate traders seeking an accessible, free solution.
User Interface, Workflow & Performance
The user interface of Stock Chart is designed with simplicity and functionality in mind. Navigation is intuitive, allowing users to search for stocks by ticker symbol, access recent activity, and switch between different chart types with minimal effort. The layout prioritizes chart visibility, with controls positioned for easy access without cluttering the screen. The app supports touch-based interactions such as zooming and panning, which are essential for detailed chart analysis.
Workflow efficiency is enhanced by the ability to save favorite stocks and view multiple timeframes in a single session. Users can quickly compare short-term momentum with long-term trends. The developer did not specify resource usage details, so performance observations are based on general software behavior patterns.
However, the app’s 15.7 MB size suggests a lightweight footprint, which typically correlates with low memory and CPU consumption. Stability appears to be a priority, as the app functions without reported crashes in its initial release. The app runs entirely on the device, which contributes to faster response times compared to cloud-dependent tools.
Compatibility & System Requirements
Stock Chart is compatible with Android devices and is available for download on Google Play. The app is designed to function on a wide range of Android smartphones and tablets, though specific hardware requirements were not listed by the developer. The installation size is 15.7 MB, indicating a minimal storage footprint. The software version is 1.0.0, released on July 15, 2023.
Exact system requirements were not listed. Compatibility information is limited to the Android operating system. Users should ensure their device is running a recent version of Android to support the app’s features, especially real-time data streaming.
The developer did not specify minimum RAM or processor requirements. While no performance benchmarks were provided, the app’s lightweight nature suggests it should run smoothly on most modern Android devices. For users with older or low-end hardware, testing on a compatible device is recommended.
Pros and Cons
Pros
- Completely free to use with no in-app purchases or ads reported
- Access to real-time stock quotes for major US exchanges
- Comprehensive set of technical indicators and charting tools
- Support for multi-time frame analysis
- Intuitive and easy-to-navigate interface
- Lightweight installation size (15.7 MB)
Cons
- Exact system requirements not specified by the developer
- Limited to Android platform; no support for iOS or desktop
- No cloud synchronization or cross-device access
- Real-time signal accuracy not verified or documented
- App availability restricted to Google Play
FAQ Section
Is Stock Chart available for iOS devices?
Currently, Stock Chart is only available for Android devices. The developer has not released a version for iOS.
Does the app require an internet connection?
Yes, real-time stock quotes and chart updates require an active internet connection. Offline functionality is limited to cached data.
Are the buy and sell signals accurate?
The app generates signals based on technical indicator logic. However, the accuracy of these signals depends on market conditions and individual trading strategies. The developer did not provide performance data on signal reliability.
Can I use Stock Chart without creating an account?
Yes, the app does not require registration or account creation. All features are accessible immediately after installation.
How often does the app update?
The current version is 1.0.0, released on July 15, 2023. No information about future update frequency was provided by the developer.
Final Thoughts + CTA
Stock Chart delivers a robust set of technical analysis tools tailored for users interested in US stock markets. Its free model, combined with real-time data, multi-time frame support, and a wide array of indicators, makes it a compelling choice for traders seeking an accessible alternative to paid platforms. The clean interface and lightweight design enhance usability, especially for mobile-first users. While platform limitations and lack of detailed system requirements are notable constraints, the app’s core functionality remains strong and reliable.
It is particularly well-suited for beginners exploring technical analysis and intermediate traders who want a supplementary tool. For those already invested in a desktop-based workflow, the mobile-only nature may be a drawback. Nevertheless, as a standalone mobile solution, Stock Chart stands out in its category. The absence of ads or in-app purchases further strengthens its value proposition.
Download Stock Chart now to access powerful technical analysis tools on your Android device.